
Analytics
This article is for WebinarJam and EverWebinar.
View analytics for each webinar you present, so you can understand how well your message is performing.
Launch WebinarJam or EverWebinar to see analytics for each type of webinar.
- Click Analytics in the left-side menu
- Select a Webinar, Session(s), and Event(s) from the drop-down fields
Traffic
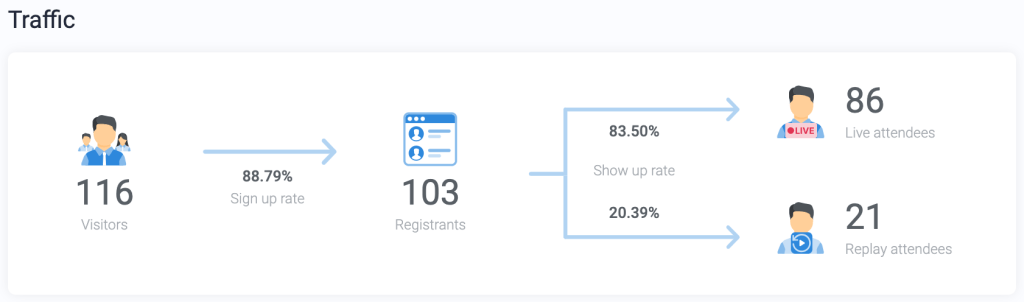
Traffic analytics show:
- Total visitors to your registration page (WebinarJam-hosted or custom)
- Percentage of visitors who became registrants (sign-up rate)
- Total registrants for the webinar
- Total registrants who attended the broadcast during its scheduled time
- Total registrants who attended the replay
- Percentage of registrants who attended each viewing (show-up rate)
Pro Tips:
- Hover over each statistic in the traffic graph to see the analytics divided by device type: computer, phone, tablet, or unknown.
- The number of registrants may be higher than the number of visitors to the registration page if some people are registered through one-click registration or auto-subscription.
Engagement
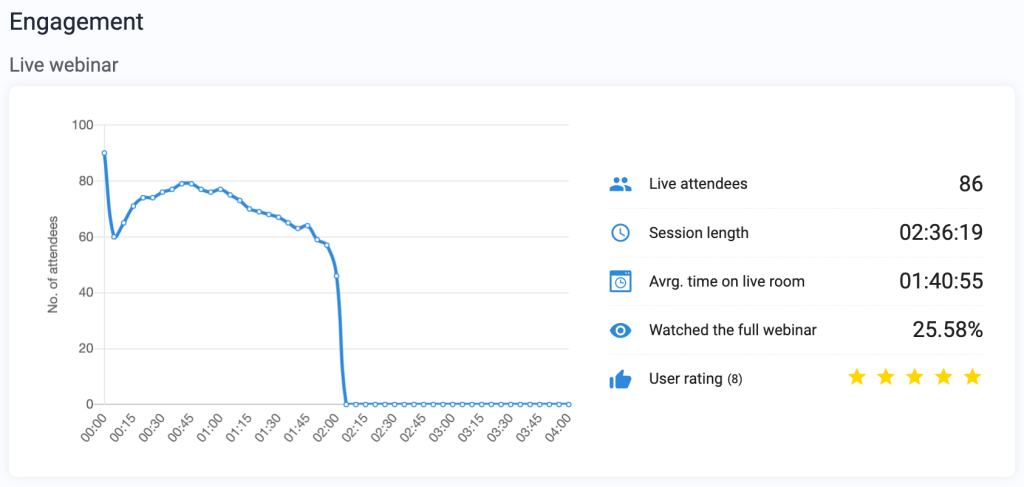
Engagement analytics show Live Webinar and Replay statistics separately:
- Total number of attendees who entered the webinar room
- Total length of the webinar session
- Average length of time any one attendee stayed in the room
- Percentage of attendees who watched the whole webinar
- Average user rating and number of ratings given for the webinar
No. of attendees graph: Number of attendees in the room at a given time during the webinar (shown at 5-minute intervals).
Monetization
Monetization analytics show:
- Registration fees (if the event was a paid webinar)
- Sales from the live room (if a product offer was shown)
- Sales from the replay room (if a product offer was shown)
Sales conversion is the percentage of attendees who made a product purchase. People who registered but did not attend are excluded from the conversion percentage.
Earnings per attendee is the total revenue generated during the broadcast divided by the total number of attendees. For example: $100 earned divided by 50 attendees would equal $2 earned per attendee.
Pro Tips: To track revenue for an event, some advanced configurations are required. Learn more:
Notifications
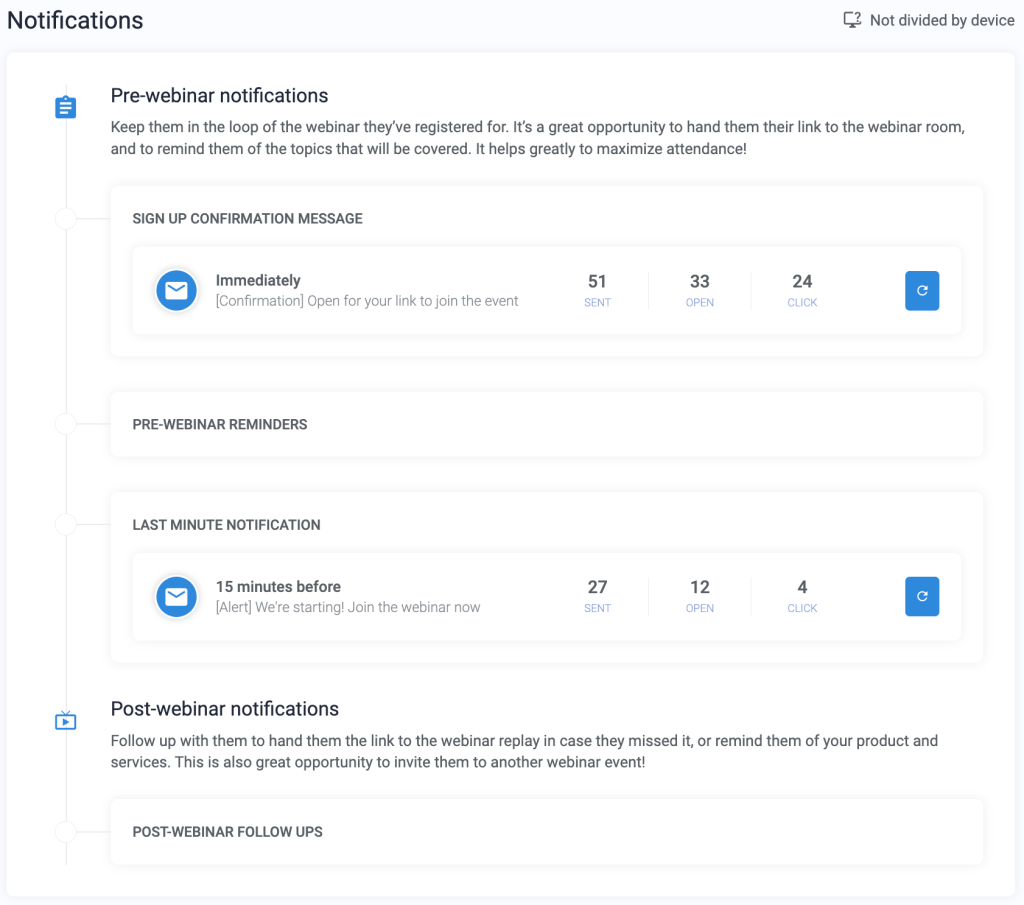
Notification analytics show:
- How many times a message was sent
- How many recipients opened each email
- How many times a link in each message was clicked
The blue reset icon resets all email statistics to zero. Be careful: This cannot be undone.